The magic of automatic reporting ✨

An Introduction

Rhian Davies

About Jumping Rivers

  • Data science & machine learning
  • Training courses
  • Dashboard development and deployment
  • Infrastructure
  • Managed Posit services

Cartoon of three people working at computers

Meet Maria

  • Public Health analyst
  • Delivers monthly reports on NHS Workforce statistics
  • Uses Excel to analyse data
  • Uses Word to write branded reports

Cartoon of a woman smiling

Monthly Reports

artoon of a net capturing a cloud

Monthly Reports

Cartoon of a net capturing a cloud and a robot sweeping up data

Monthly Reports

Cartoon of a net capturing a cloud, a robot sweeping up data and a computer with some dashboards

Monthly Reports

Cartoon of a net capturing a cloud, a robot sweeping up data, a computer with some dashboards and a robot at a laptop typing.

Back to square one

  • The data was wrong - can you re-run the analysis?
  • Your manager loves it - can you do it for another region?
  • Next month - do it all again.

There must be a better way

Hello quarto 👋

What is quarto?

The quarto logo: A circle cut into four quadrants next to the word quarto

An open-source scientific and technical publishing system

A schematic representing the multi-language input (e.g. Python, R, Observable, Julia) and multi-format output (e.g. PDF, html, Word documents, and more) versatility of Quarto.

Artwork from “Hello, Quarto” keynote by Julia Lowndes and Mine Çetinkaya-Rundel, presented at RStudio Conference 2022. Illustrated by Allison Horst.

Example report
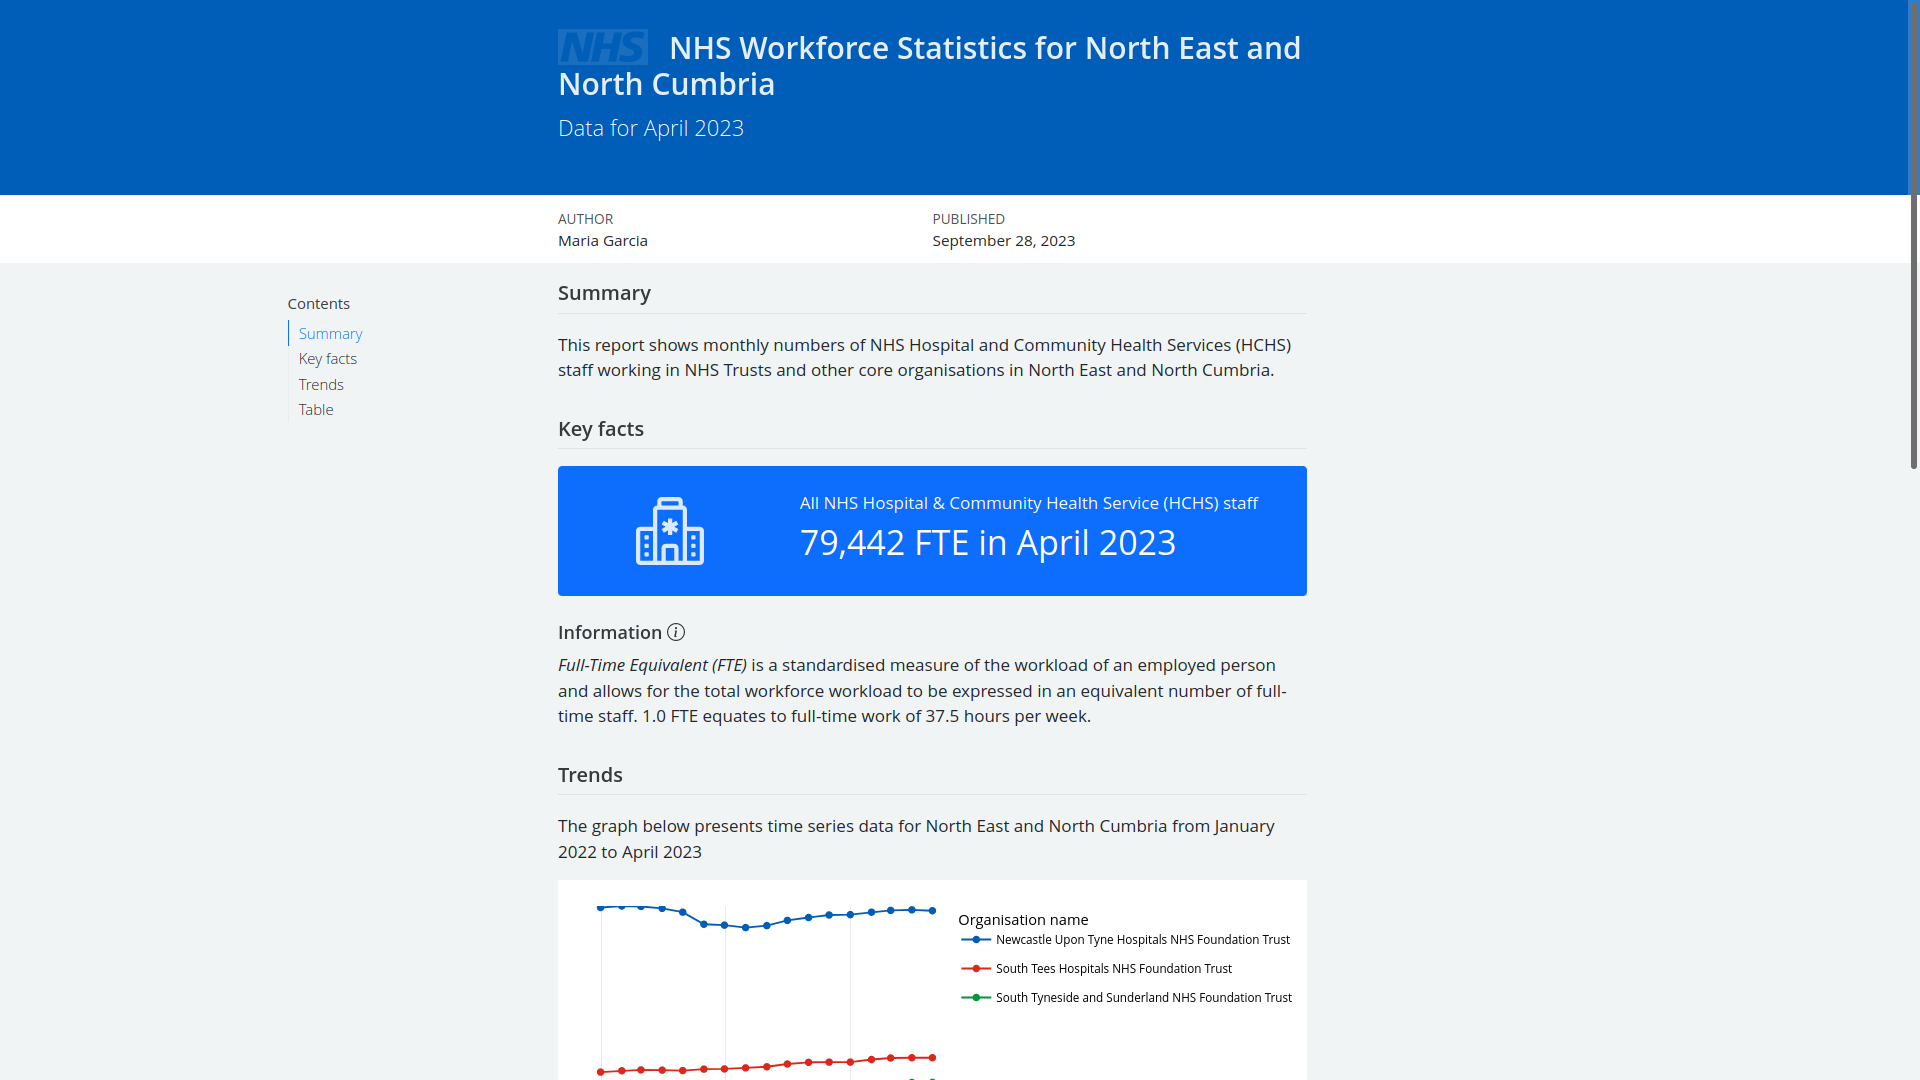
statsrhian.github.io/example-quarto-report/example-report.html

Template based-reports

---
title: "NHS Workforce Statistics for `r params$ics_name`"
subtitle: "Data for `r params$month_year`"
author: "Maria Garcia"
date: "2023-09-28"
params:
  ics_name: "North East and North Cumbria"
  month_year: "April 2023"
---

Interweave text and code 🧶

Read in the data

filename = glue("NHS Workforce Statistics, {params$month_year} England and Organisation.xlsx")

Clean the data

staff_group = 
  staff_group |>
  filter(`ICS name` == params$ics_name) |>
  select(`Organisation name`, `Total`,
         `HCHS Doctors`, `Nurses & health visitors`,
         `Midwives`, `Ambulance staff`) 

Add insight

The table below shows the total number of doctors and nurses for each organisation within `r params$ics_name`. We can see that the organisation with the most midwives is the `r pull(max_midwives, "Organisation name")` with `r round(max_midwives$Midwives)` staff.

Re-run next month

---
title: "NHS Workforce Statistics for `r params$ics_name`"
subtitle: "Data for `r params$month_year`"
author: "Maria Garcia"
date: "2023-09-28"
params:
  ics_name: "North East and North Cumbria"
  month_year: "May 2023"

Report a different region

---
title: "NHS Workforce Statistics for `r params$ics_name`"
subtitle: "Data for `r params$month_year`"
author: "Maria Garcia"
date: "2023-09-28"
params:
  ics_name: "Lancashire and South Cumbria"
  month_year: "May 2023"

Maria is happy

  • More reproducible workflow
  • Fewer mistakes
  • Spends less time formatting the reports manually
  • Spends more time adding insight

Cartoon of a woman smiling

Get started